linstagrow.
000%
Work Services Process Pricing FAQ
Book a free audit

hello@linstagrow.com · Replies in under 4 hours

3 client slots open

Infographics that
stop the scroll —
and start the DMs. fill the pipeline. build authority. close the deal.

We turn your expertise into single-frame infographics and animated builds people actually save and repost. Research, layout and design — delivered in 48 hours.

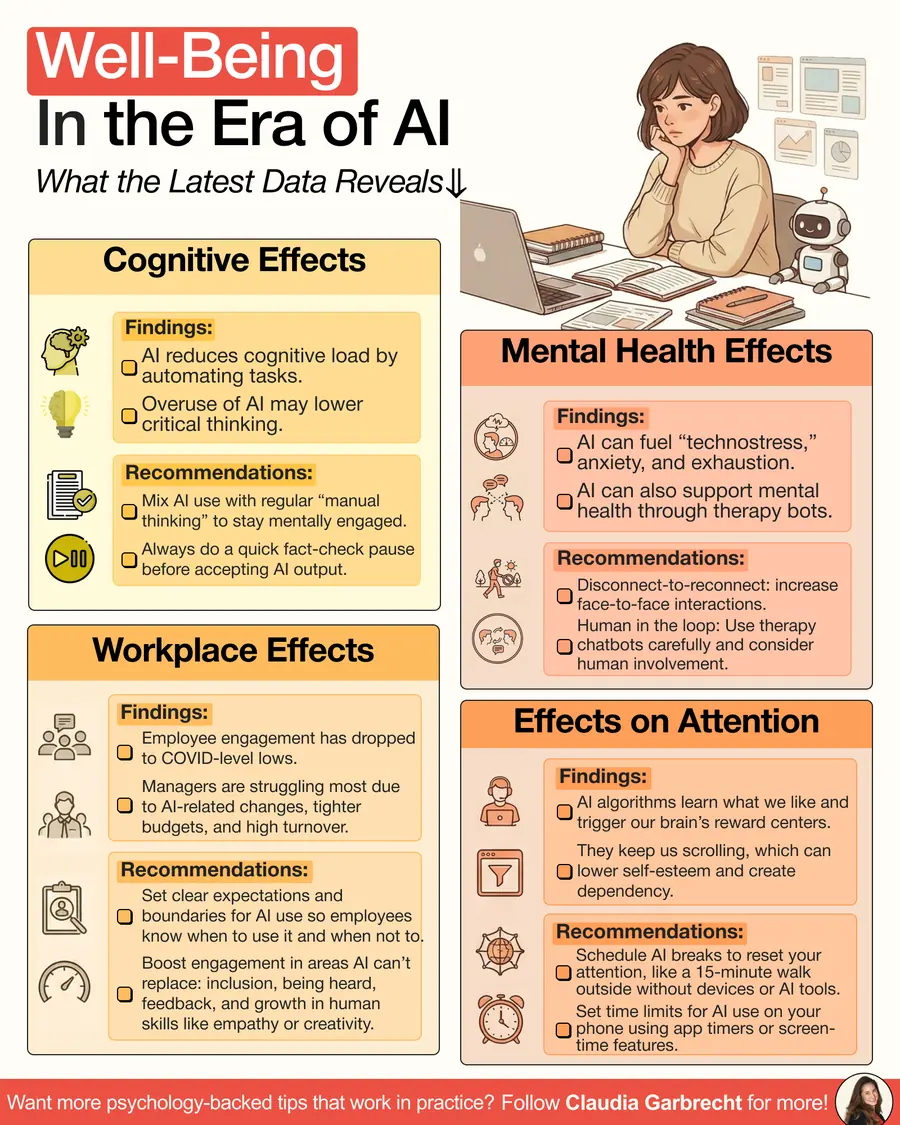
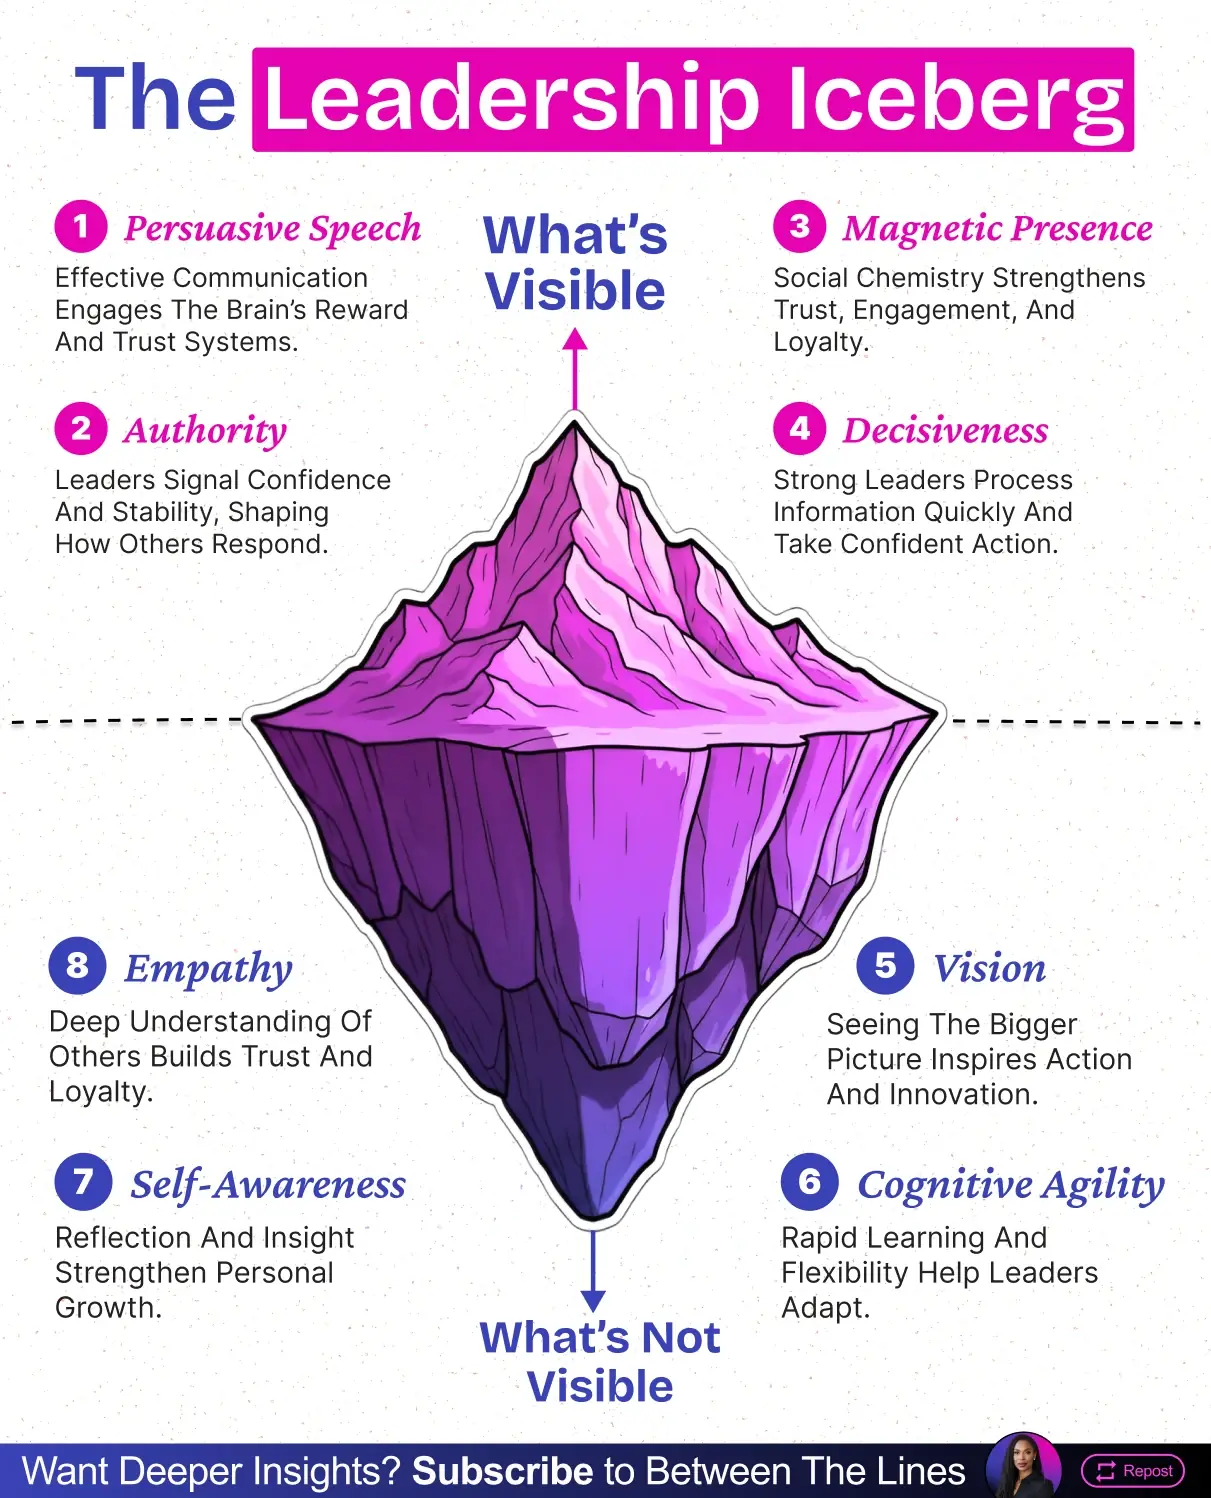
Workplace psychology infographic for Claudia Garbrecht
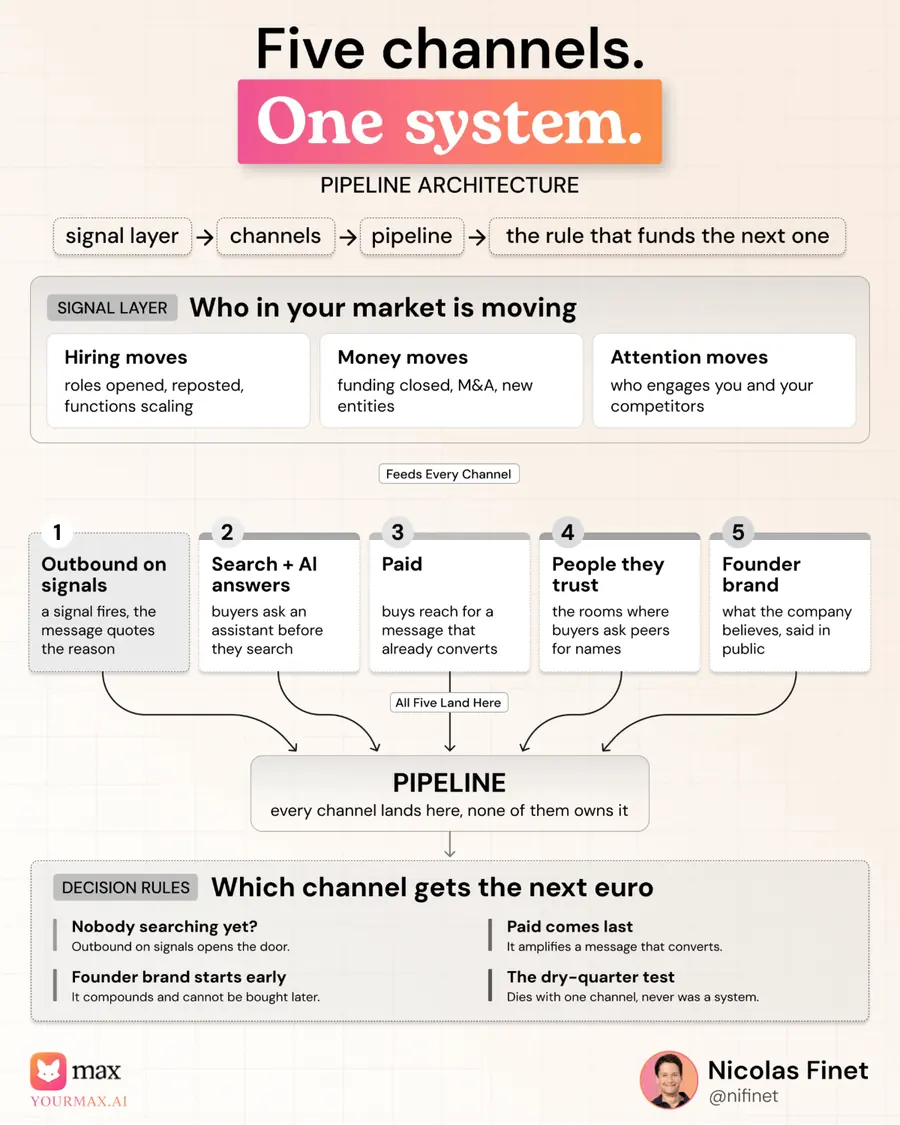
Animated infographic mapping five go-to-market channels into one pipeline, for Nicolas Finet Animated
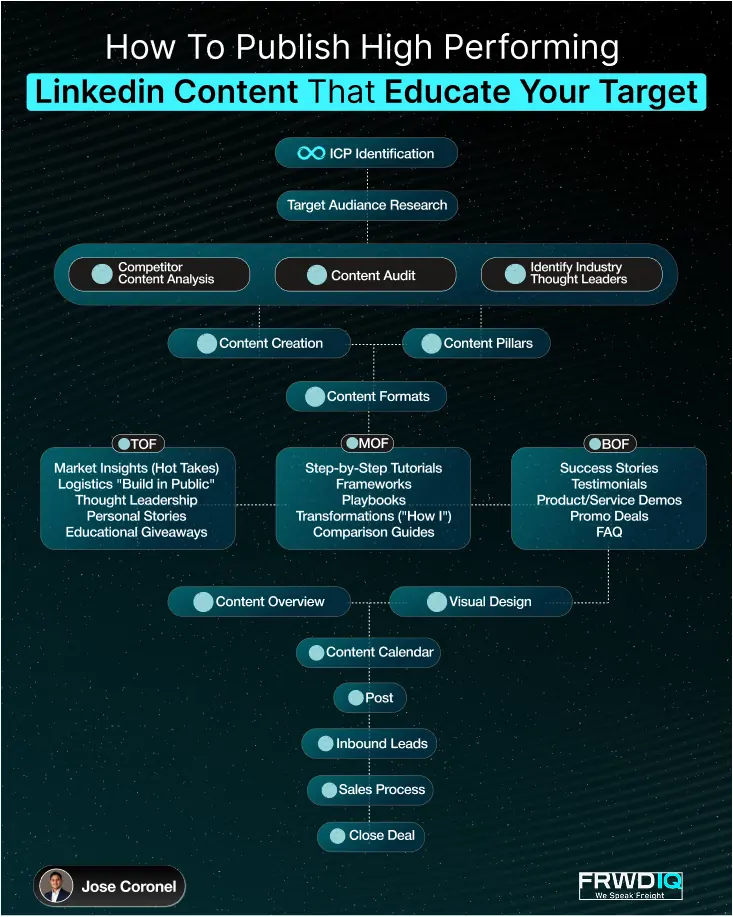
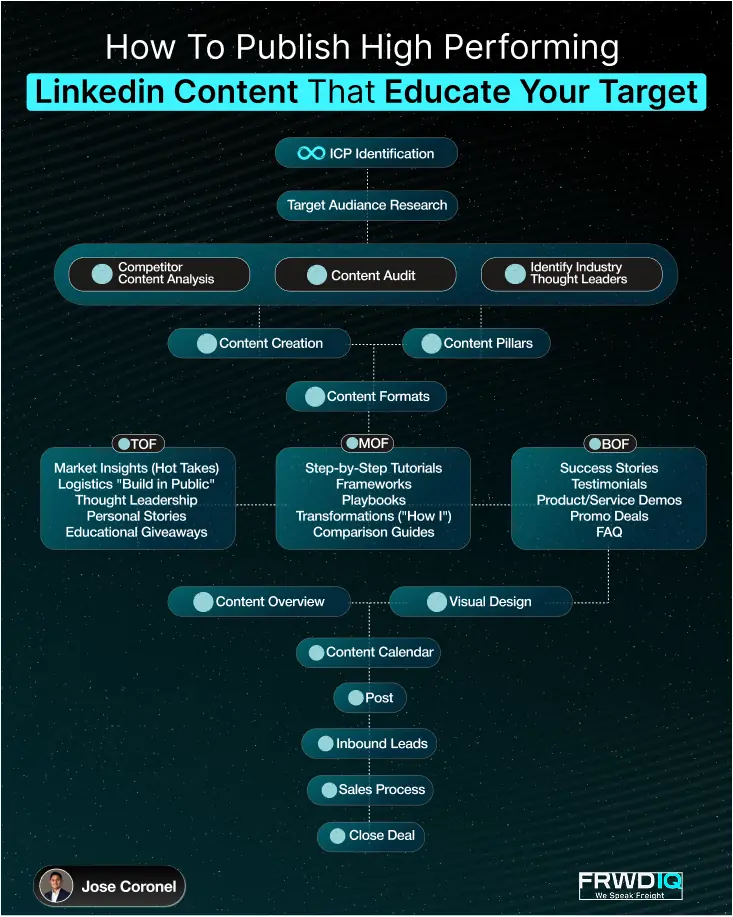
LinkedIn content strategy flow for Jose Coronel
900+ infographicsdesigned for clients
30+ client brandsfounders, coaches, execs
50+ animatedlooping infographics
The founders, coaches and operators we design for

Trusted By 20+ Brands

PitchNinjas FRWD IQ Framework AMZ Scale The Excellence Factory University of Cincinnati Greatna RallyUp
0+ Infographics designed and published for clients
0+ Client brands — founders, coaches, execs and operators
0+ Animated infographics built for LinkedIn
48–72h Average turnaround from brief to final files
The real problem

Your best ideas are dying
in plain text.

You know your market better than anyone in your feed. But expertise that isn’t designed gets scrolled past — and the loudest generalist wins the client instead.

Symptom 01

You post consistently and nothing compounds

Three good posts a week, 900 impressions each, zero inbound. The algorithm isn’t punishing you — the format is. Text-only posts get read by people who already follow you.

The fix: a saveable visual format that keeps earning reach for weeks after you publish.
Symptom 02

Your designer makes it pretty, not persuasive

Beautiful gradients, no argument. An infographic is a claim with evidence attached — if the headline doesn’t assert something and the frame doesn’t prove it, it’s decoration.

The fix: narrative-first design. We map the argument before anyone opens Figma.

Symptom 03

Doing it yourself costs you six hours a week

Six hours of Canva you could have spent on customers. And because every post looks different, nobody recognises your work in the feed — so nothing accumulates into a brand.

The fix: one visual system, reused forever. Instantly recognisable, 15 minutes of your time per post.

What we design

Two formats.
Both built to be saved.

Everything we make is one of two things — a single frame that earns the save, or a short loop that earns the second look. Same research, same grid, same standard.

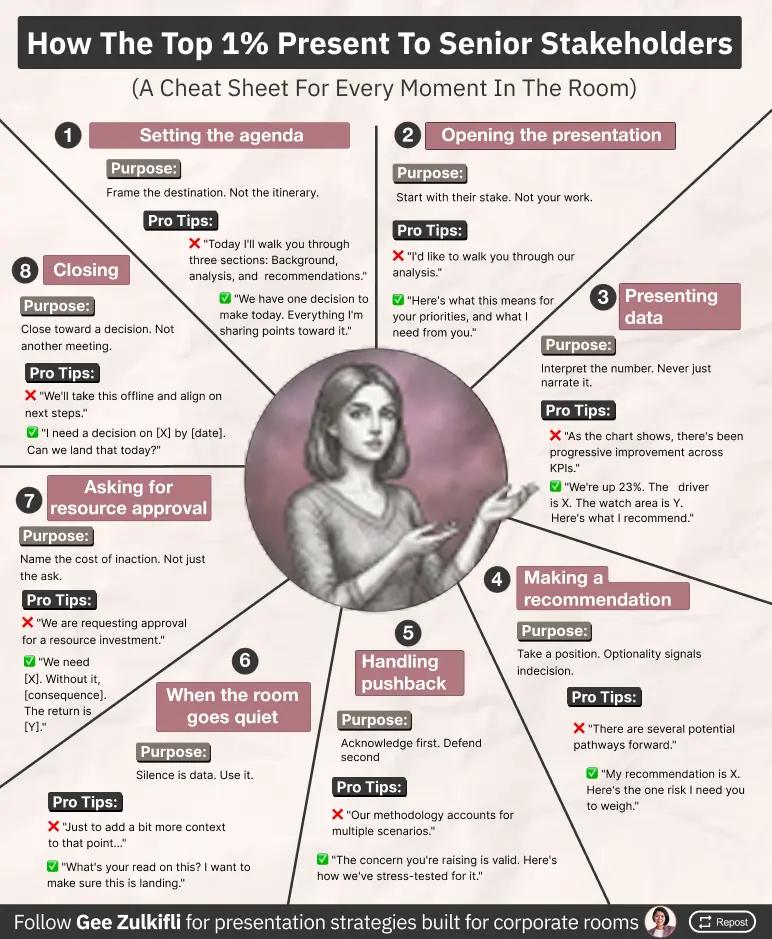
Static single-frame infographic designed for Gee Zulkifli
01 — Static

Static infographics

One dense frame that carries a whole argument. We do the research, cut it to what matters, and lay it out on a grid the eye can learn in seconds. Built to be screenshotted, saved and pasted into someone else’s deck.

Research & synthesis Copy & hierarchy Custom illustration Charts & data PNG + PDF export
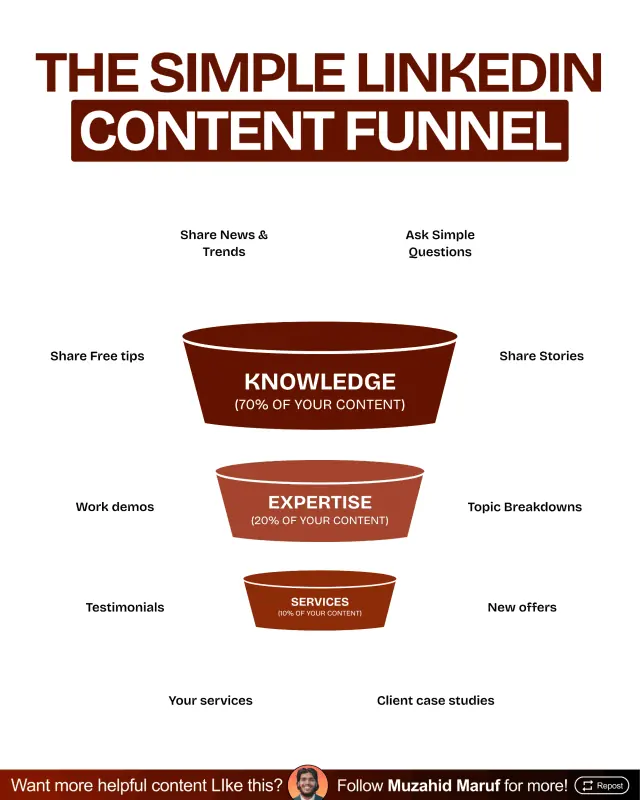
Animated infographic loop designed for a LinkedIn content funnel post Animated
02 — Animated

Animated infographics

The same information design, in motion. Each loop reveals its argument one beat at a time, so the reader stays for the whole thing — built for feeds where movement buys the extra second of attention.

Frame-by-frame build Paced reveals Seamless loop Feed-optimised weight MP4 + GIF export

Both formats ship on the same visual system, so a static post and an animated one still read as the same brand.

Narrative first Designed to be saved 48-hour turnaround Built to compound
How it works

Brief on Monday.
Posting on Wednesday.

No 40-page onboarding, no design-by-committee. One call, one narrative map, one round of notes, done.

Unlimited revisions You own every file Slack or email, your call
Start with a free audit
linstagrow / your-brand / live-preview
01

The audit call

Thirty minutes. We look at your last twenty posts, find the two ideas that got traction for the wrong reasons, and pick the angle worth building a format around.

Day 0 · 30 min
02

The layout map

Before any design happens you get the frame mapped out: the claim, the blocks, the hierarchy, the credit bar. You approve the argument in a doc — cheap to change, expensive to get wrong later.

Day 1 · async
03

The design sprint

We build the full frame on your visual system — custom type, real diagrams, no stock. You get a live Figma link, comment directly on it, and we turn changes the same day.

Day 2 · 48h from brief
04

Ship, measure, iterate

Exports in every format you need, plus the caption and first comment. Two weeks later we send you a one-page read on what the data says to double down on.

Day 3 → ongoing
Who we design for

A look at the
current book.

Turning peer-reviewed research into something readable in fifteen seconds.

An ongoing series on burnout, motivation and well-being at work — each post a full study condensed into one frame.

CG
Claudia GarbrechtWorkplace psychology
Infographic for Claudia Garbrecht
27designs
in the set
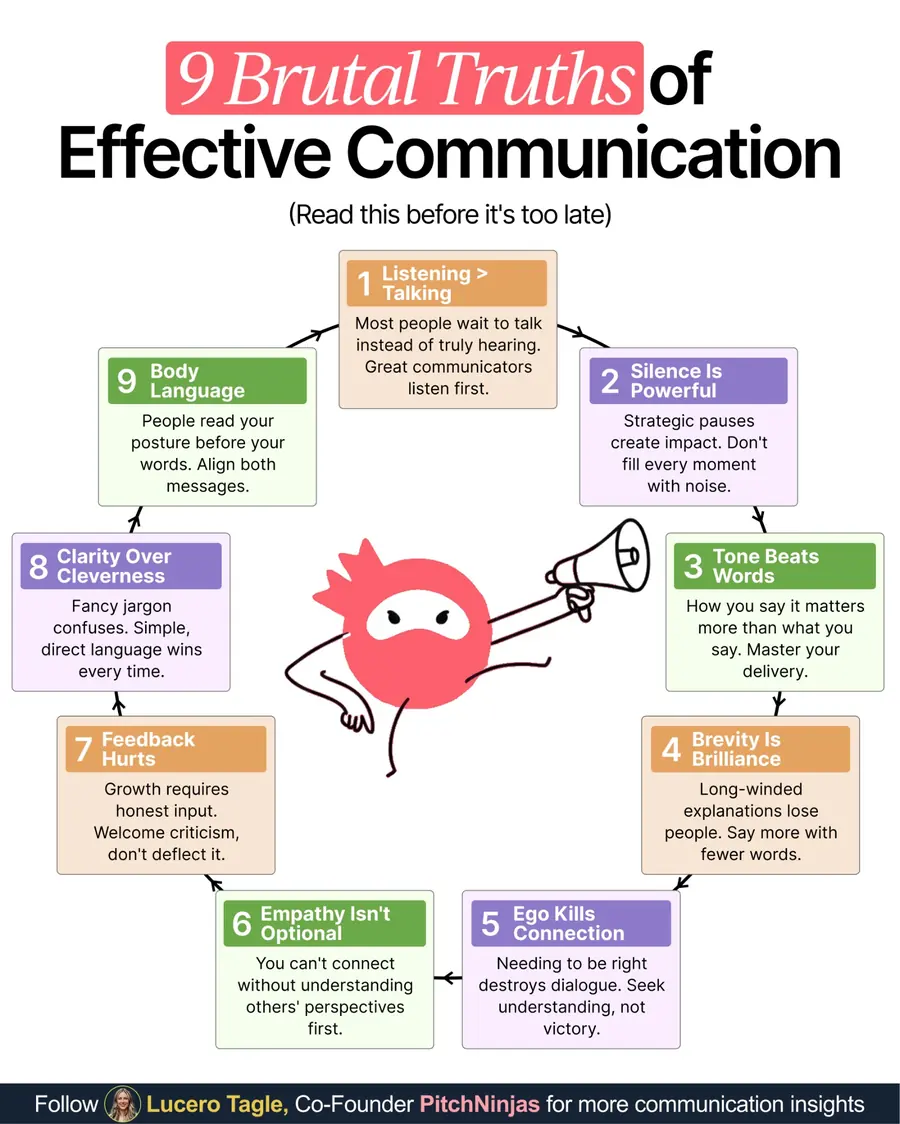
One hard communication problem per post, with the exact scripts side by side.

A recurring cheat-code format for a public-speaking practice — what not to say on the left, what to say instead on the right.

LT
Lucero TagleCo-founder, PitchNinjas
Infographic for Lucero Tagle
15designs
in the set
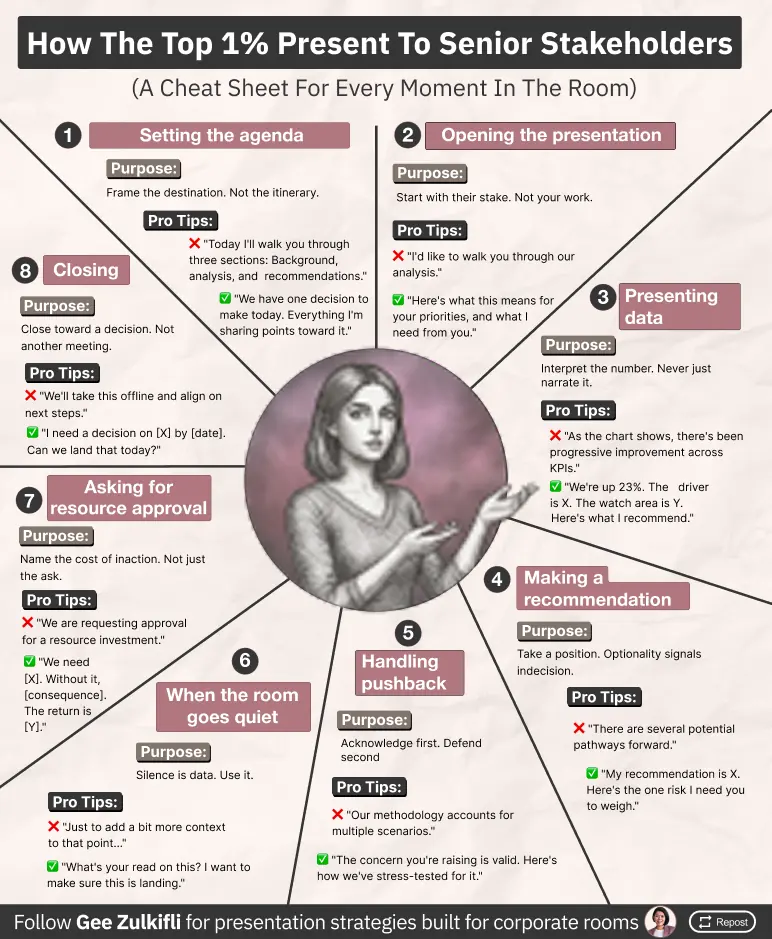
Cheat sheets built to look like reference material, not social content.

Print-inspired guides to presenting in corporate rooms, set on a paper texture so they read as something you keep rather than scroll past.

GZ
Gee ZulkifliPresentation strategy
Infographic for Gee Zulkifli
8designs
in the set
The same information design, animated one beat at a time.

Ten looping infographics built for feeds where motion buys the extra second of attention — funnels, comparisons and reveals.

Selected clientsAnimated infographics
Infographic for Selected clients
10looping
infographics
Pricing

Flat rates. No hourly.
No surprises.

Priced by format, same as we design. Every plan includes research, copywriting, design and exports. Cancel any month.

01 — Static

Static infographics

Single-frame designs, delivered monthly on a rolling plan.

Starter

A steady presence — three posts a week.

$500/ month

12 static infographics every month.

  • 12 static infographics / month
  • Research, copy and layout included
  • Unlimited revisions
  • 48–72h turnaround per design
Start with 12
Save 20%

Growth

Post daily on work days — volume that compounds.

$800/ month

$1,000  20 static infographics every month.

  • 20 static infographics / month
  • Everything in Starter
  • Monthly strategy call + content map
  • Priority turnaround
Claim a client slot

3 client slots open

02 — Animated

Animated infographics

Looping builds, priced per piece — solo or on top of a static plan.

Pay per piece

Order exactly as many as you need, when you need them.

$100/ animated infographic

No minimum. No commitment.

  • Frame-by-frame animated build
  • Paced reveals, seamless loop
  • MP4 + GIF export, feed-optimised
  • 48–72h turnaround
Order an animation

Add to a plan

Bolt animation onto Starter or Growth at the same flat rate.

+$100/ animated infographic

Billed alongside your monthly plan.

  • Animate any static design we make you
  • Same visual system, same brand
  • Scheduled into your content map
  • Cancel or scale month to month
Add to my plan

The baseline guarantee: if your first design doesn’t beat your 90-day average reach, the next one is free.

Questions

Everything people
ask before booking.

Still unsure? Send us your last five posts. We’ll reply with what we’d change — free, no call required.

Send five posts

48–72 hours from an approved layout map to final files, static or animated. The map itself usually comes back the day after your audit call, so the realistic path is brief Monday, posting Wednesday.

We write it. You bring the raw material — a voice note, a messy doc, a call recording, your internal data — and we shape it into frame copy, the caption and the first comment.

That’s what the layout map is for — you sign off on the argument before we design, which kills most of the risk. After that, revisions are unlimited on monthly plans and same-day where we can. Nobody has ever hit a revision cap, because we don’t have one.

Completely. Full commercial rights on everything, plus the editable Figma file. If you leave, you keep the whole system and your team can keep shipping with it. We don’t hold your brand hostage as a retention strategy.

Yes, and about half our clients need exactly that. Send the guidelines and we’ll build a LinkedIn-specific extension of them — feed-legible type sizes, contrast that survives dark mode, chart styles that fit your palette. Where a guideline actively hurts performance we’ll show you the trade-off rather than quietly break it.

We can schedule through your tool of choice, but we recommend you press publish and handle replies yourself for the first month. Comments are where the deals actually start, and it shows when someone else is answering them. We give you a suggested reply framework instead.

Move from Starter to Growth for 20 statics a month at $800, and add animated pieces to either plan at $100 each. Honestly though — most clients get better results tightening twelve posts than spreading themselves across thirty.

We baseline your last 90 days at kickoff — impressions, saves, profile views, inbound conversations — then report against it monthly. Saves and profile views matter more than likes: they’re the two that correlate with inbound in every account we’ve run. If the numbers stall, we change the format, not the reporting.

3 client slots open

Let’s make your next post
impossible to scroll past.

Book a free 30-minute content audit. We’ll review your last twenty posts live and show you the format we’d build — whether or not you hire us.

No pitch deck, no pressure You keep the audit either way Replies in under 4 hours