 linstagrow
Real client work.
Nothing mocked up.
A selection of ninety-six published designs across twelve client sets. Click any cover to page through the full set at full size — including ten animated builds. Client names appear exactly as they are credited on the designs themselves.
All work shown is live client work as published. Names appear as credited on the designs themselves.
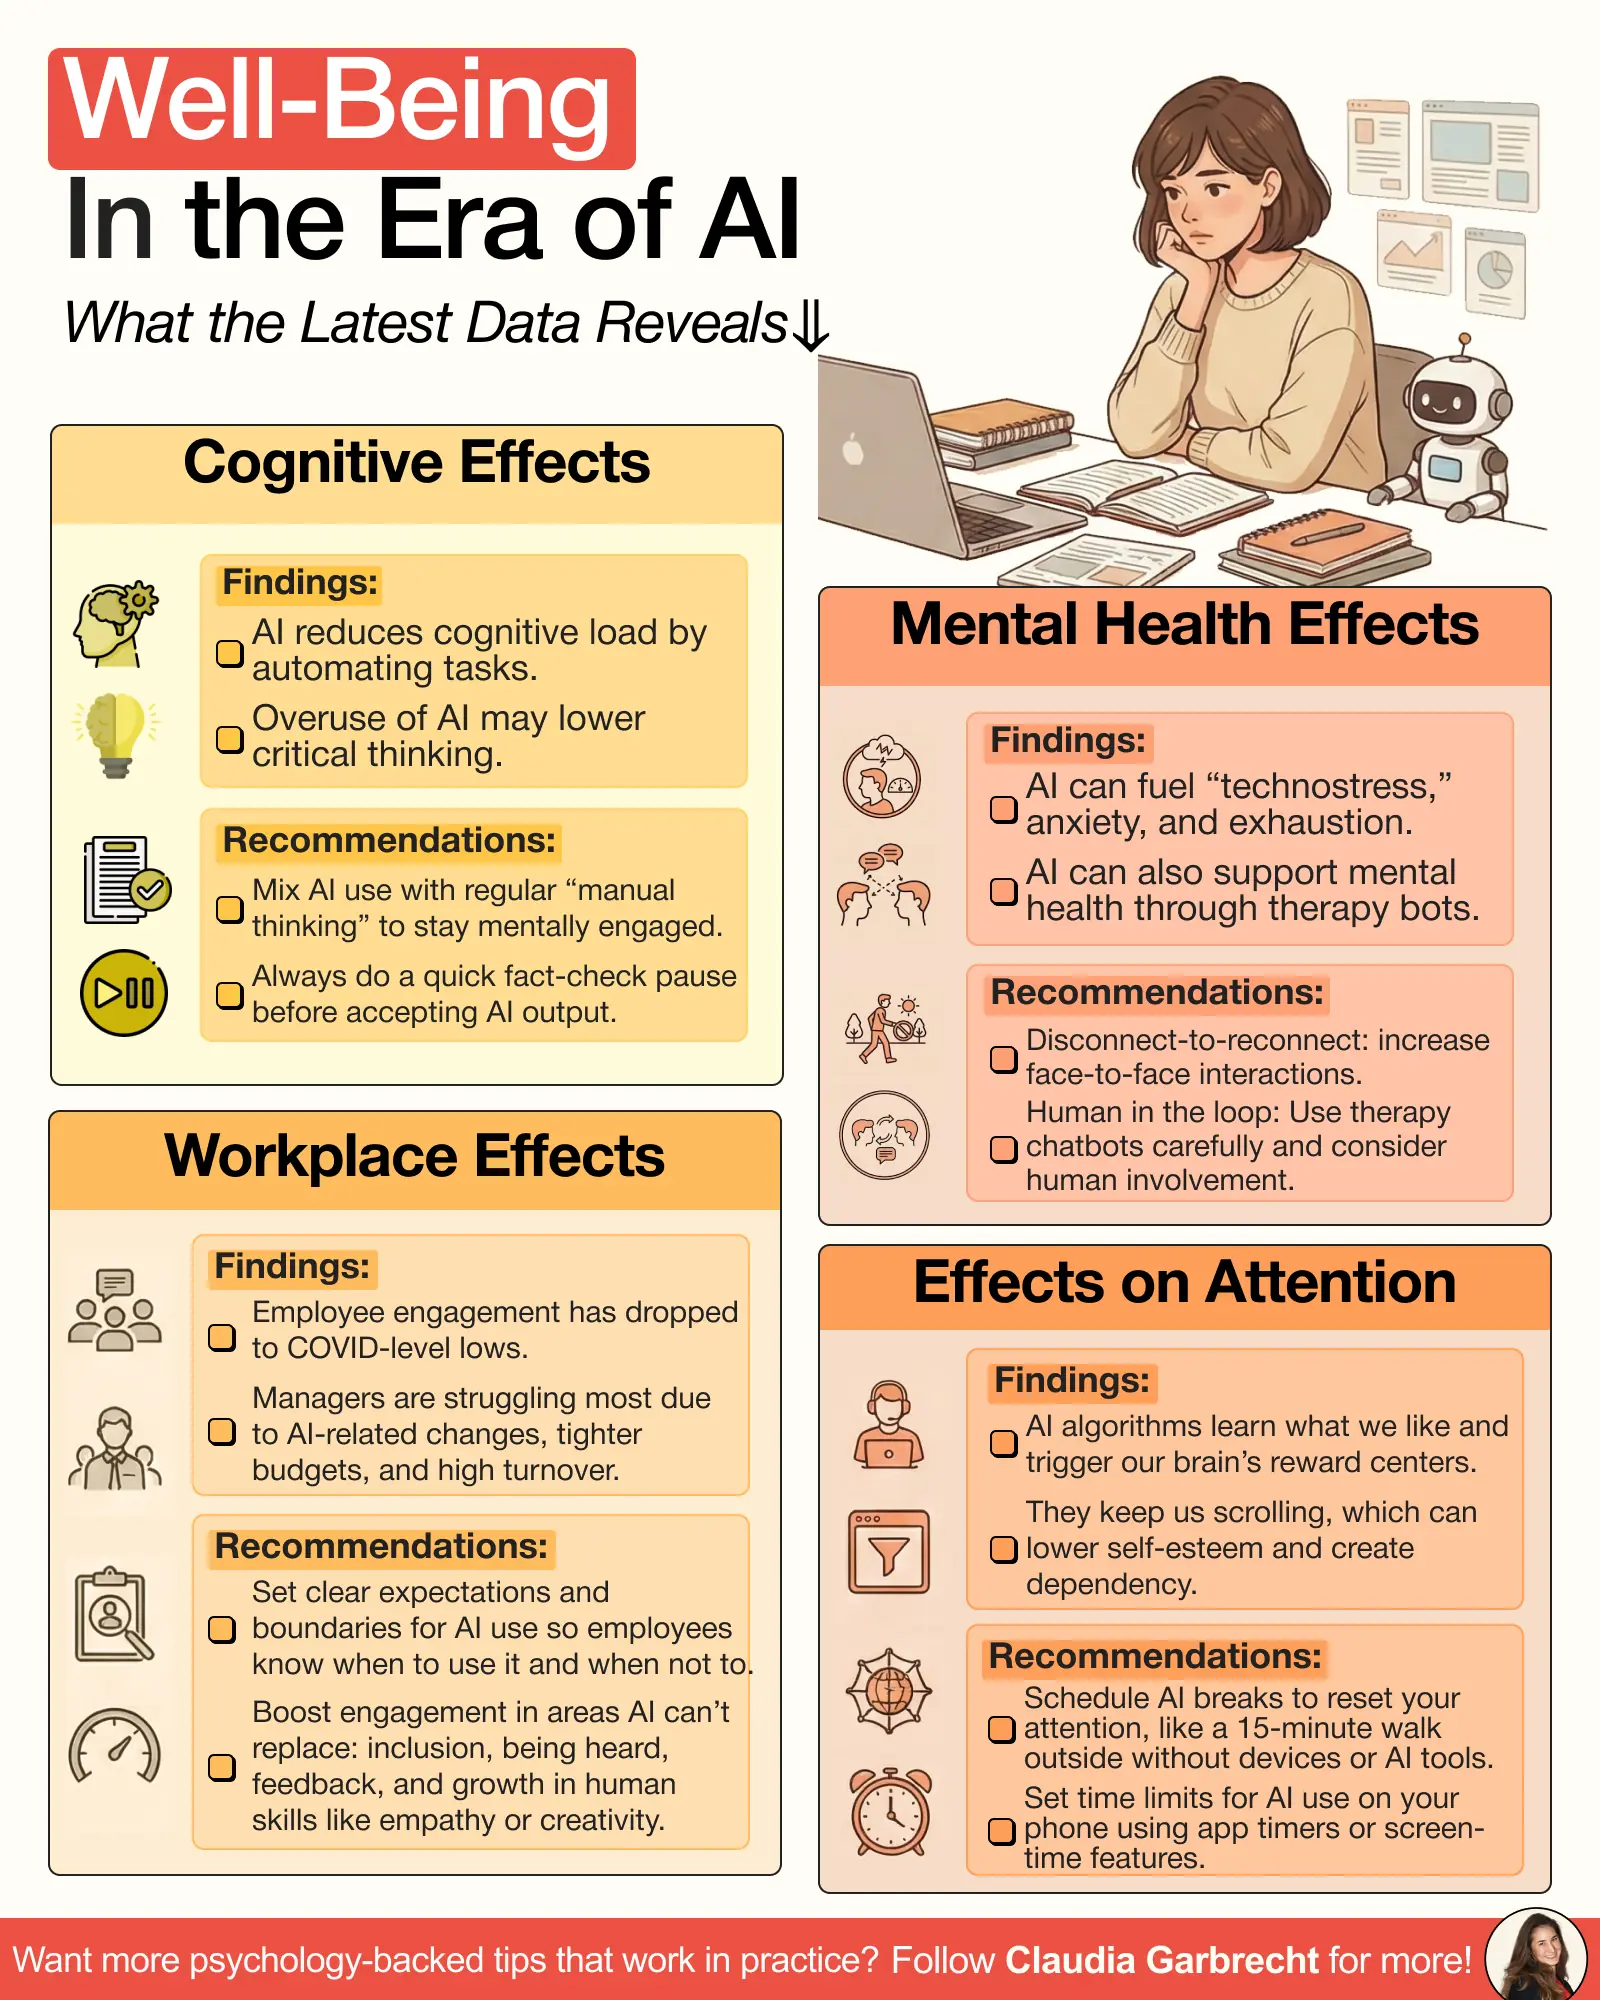
Drag the handle to compare
Same information.
Completely different result.
On the left is what most clients send us on day one — a doc full of good thinking nobody will ever read. On the right is what went out instead.
-
What we start with
A voice note, a call recording, a spreadsheet, or a 3,000-word doc titled “final v3”. You don’t need to arrive organised — that part is our job.
-
What we cut
Roughly 80% of it. One idea per slide is a hard rule, so most of the work is deciding what to delete and which single number carries the argument.
-
What ships
One finished frame on your visual system, with the caption and first comment written. Plus the Figma file, so your team can run the next one alone.
A format built to be
kept, not scrolled.
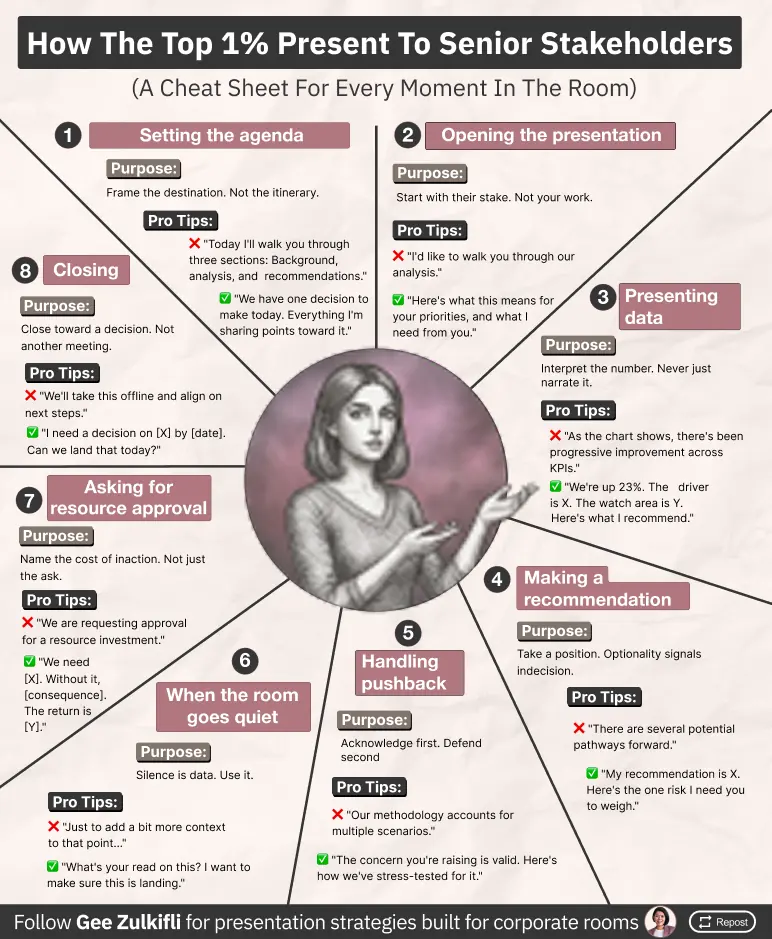
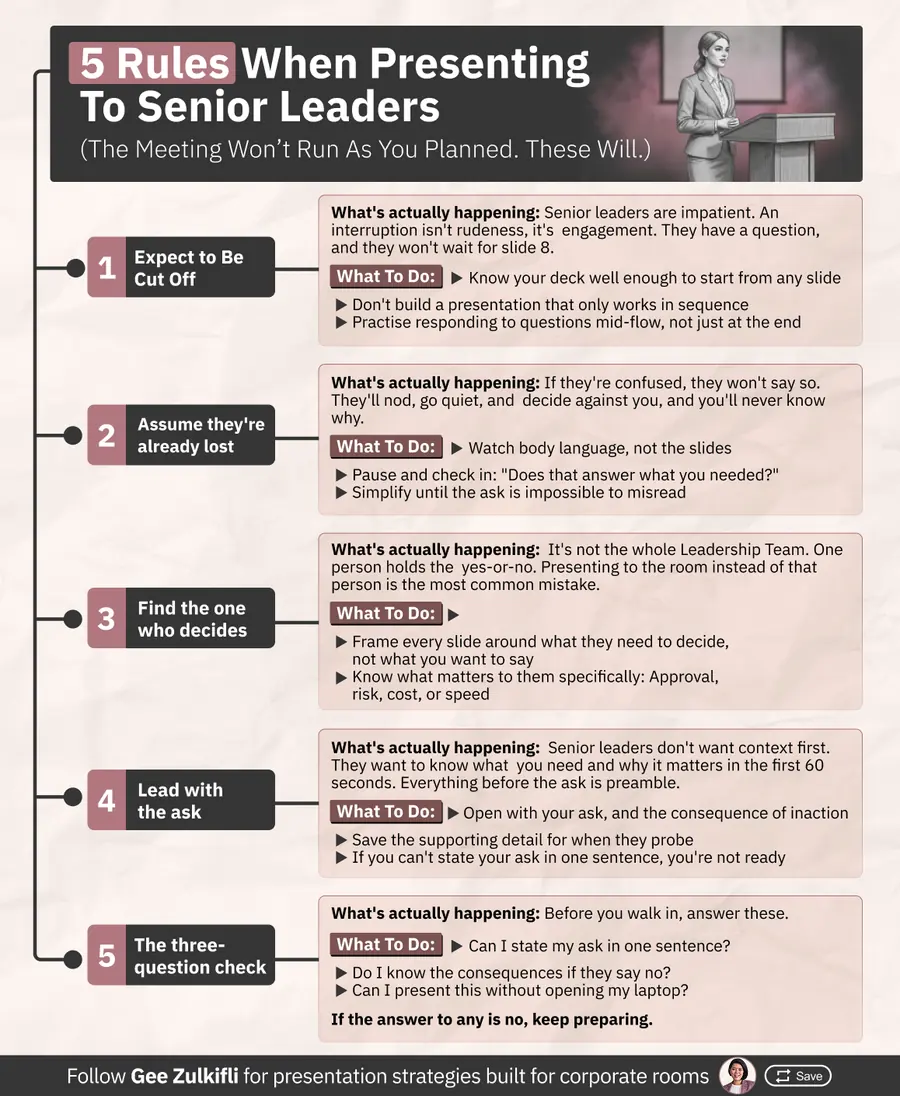
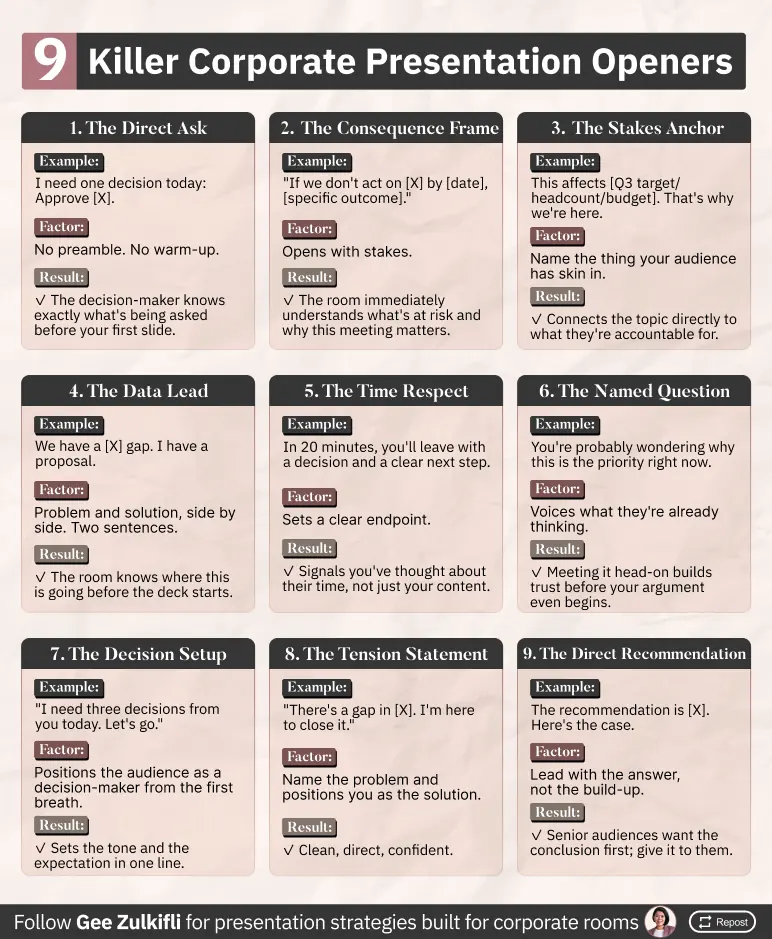
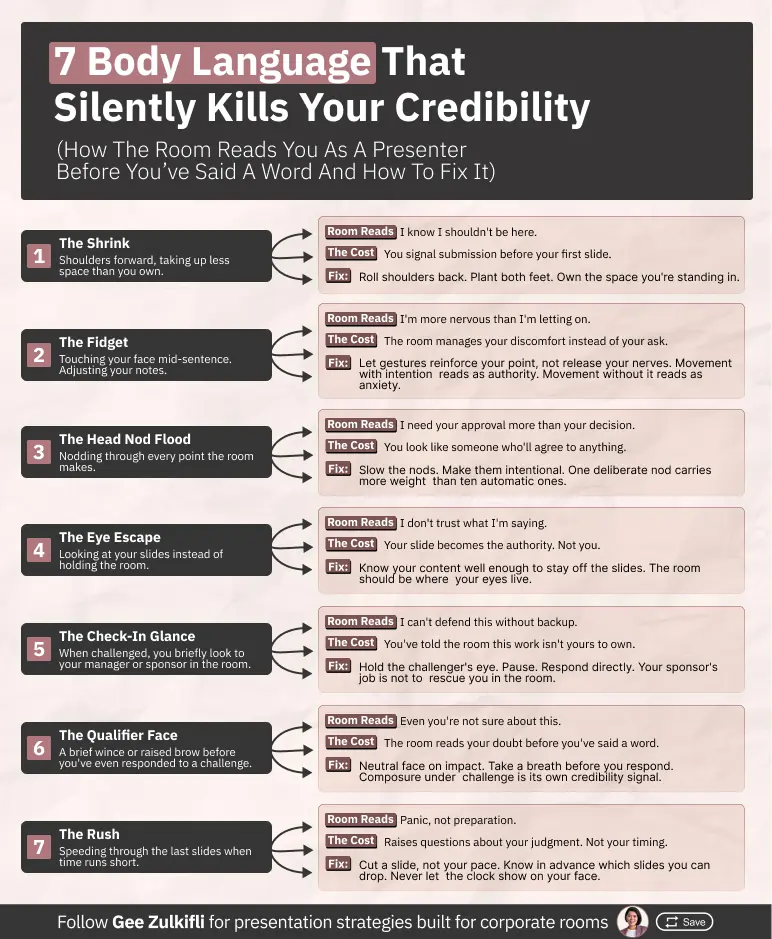
Eight cheat sheets on presenting to senior stakeholders, for Gee Zulkifli. The brief was the hard part: fit an entire situational playbook into one frame without it collapsing into noise.
Trusted By 20+ Brands








Twelve brands.
One design standard.
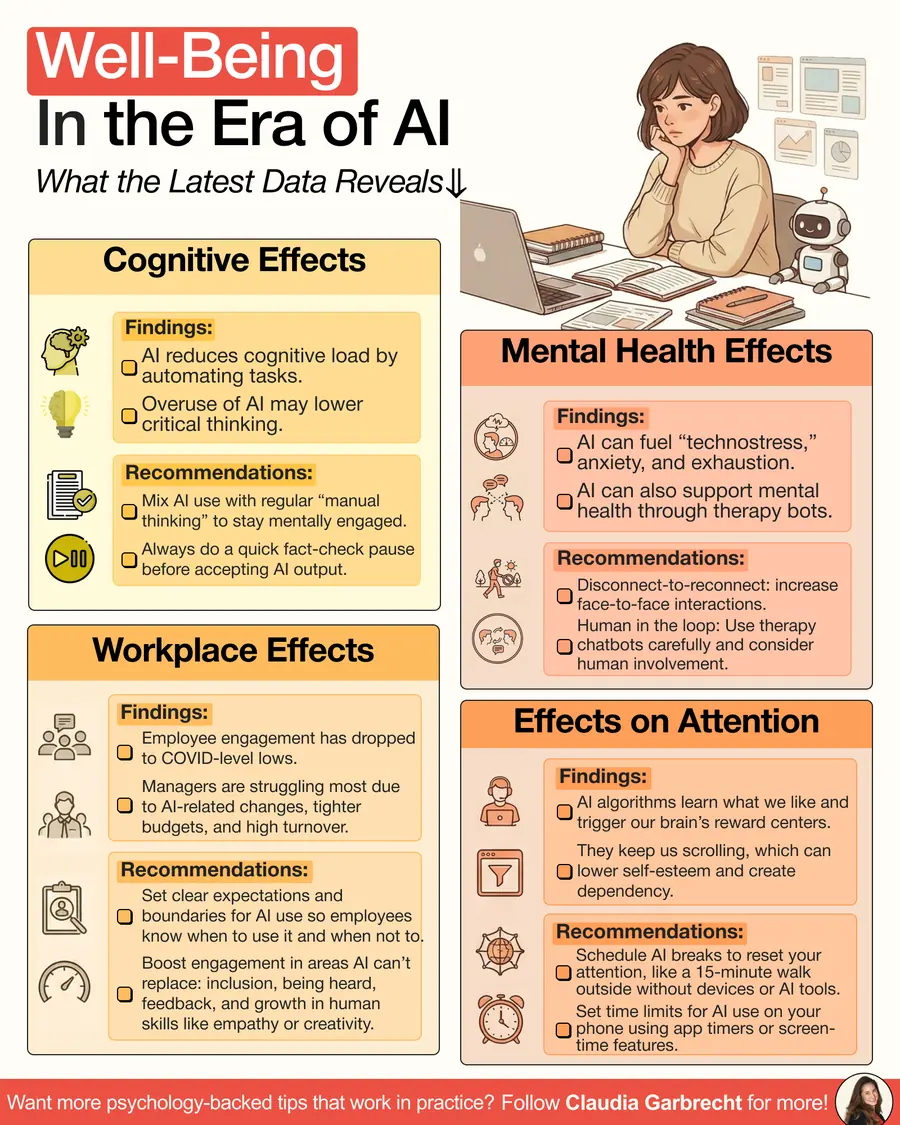
Turning peer-reviewed research into something readable in fifteen seconds.
An ongoing series on burnout, motivation and well-being at work — each post a full study condensed into one frame.
in the set
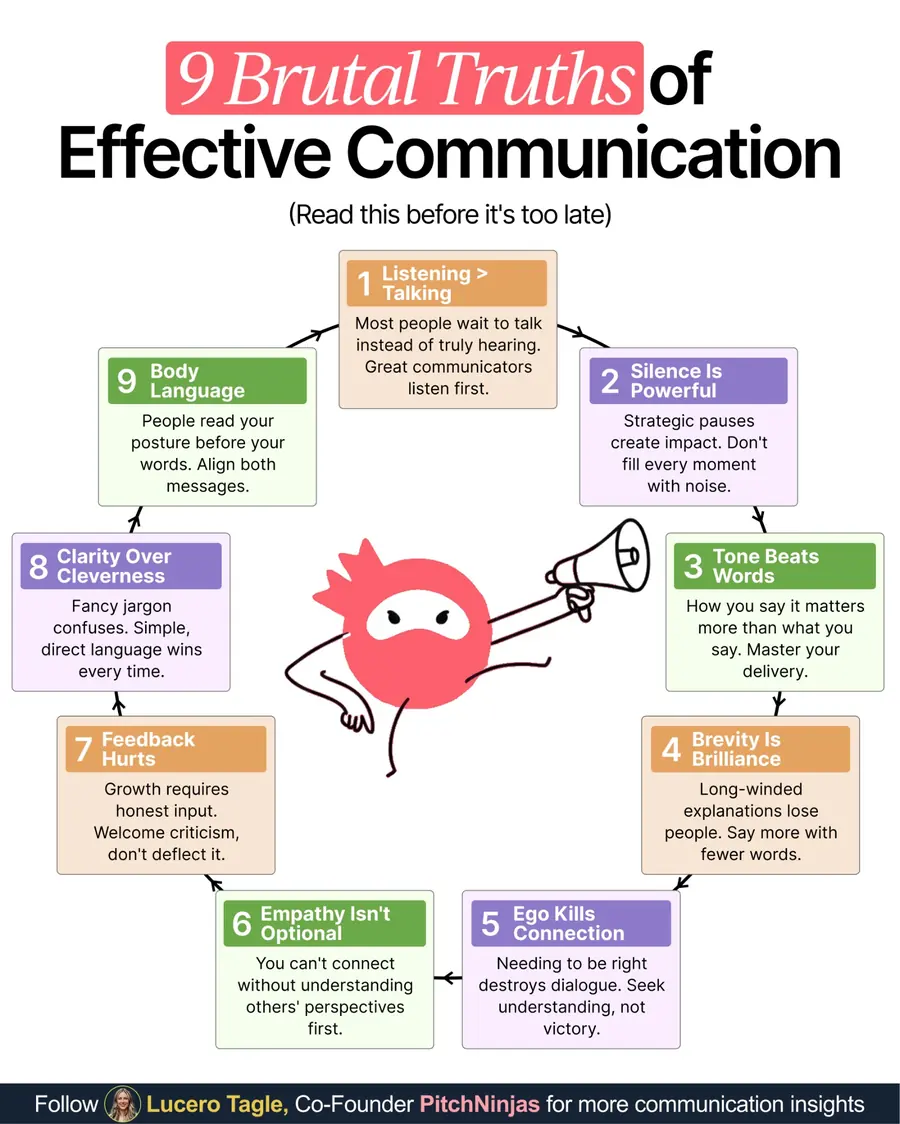
One hard communication problem per post, with the exact scripts side by side.
A recurring cheat-code format for a public-speaking practice — what not to say on the left, what to say instead on the right.
in the set
Cheat sheets built to look like reference material, not social content.
Print-inspired guides to presenting in corporate rooms, set on a paper texture so they read as something you keep rather than scroll past.
in the set
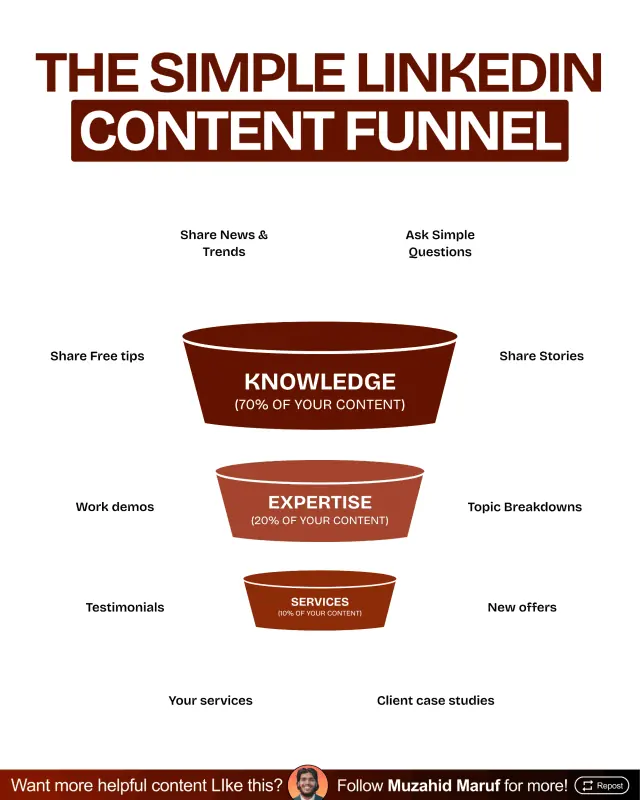
The same information design, animated one beat at a time.
Ten looping infographics built for feeds where motion buys the extra second of attention — funnels, comparisons and reveals.
infographics
Your work could be
the next one here.
Book a free 30-minute audit. We’ll go through your last twenty posts live and show you the format we’d build for you — yours to keep either way.